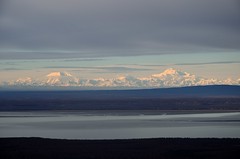
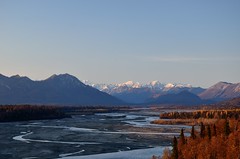
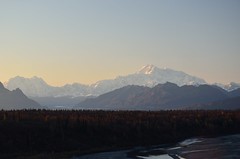
Welcome to Alaska, Baroclinic Style.

First, the weather in Alaska is different, very different. Everything you thought you had a decent grasp on is out the window; you are starting from scratch as a forecaster. Synoptic/marine storms take on a completely different structure than their land based relatives, and you are truly forecasting in a relatively data void region. Entire surface lows can form and exist in regions of the Bering Sea completely in-between all available marine observations (buoy, ship observations, C-MAN stations, etc.). Old school forecasting techniques such as advanced satellite analysis, advanced synoptic analysis, and pattern recognition are stressed to the maximum. The Bering Sea/North Pacific is the perfect breeding ground for spectacular synoptic scale cyclones amplifying on both extreme baroclinic energy (polar air mass proximity) and latent energy originating from the subtropics. 940 lows are common; 930 lows are not rare.

971 hpa low forming west of the Aleutian chain. The aftermath, for Anchorage, was the first substantial windstorm of the fall, resulting in substantial damage and widespread power outages across the area:

Image

Image

Second, Alaska terrain is incredibly complex. Glacier carved mountain terrain ranging from 4000 feet to 16,000 feet surround Anchorage and much of the other populated regions of Alaska.

Google Earth view looking into Valdez from Prince William Sound. In the background, on the left, is the 16,000 shield volcano, Mt. Sanford, which dominates the local terrain:

Image

Complex terrain, defined:

Image

Local pressure gradients, complex terrain flows, barrier jets, gap accelerations/winds, mountain wave dynamics, etc. dominate the local weather patterns, and they are innately intertwined with the track, position, intensity, and deepening/weakening rate of the synoptic scale cyclone. Small errors in the synoptic forecast can result in the difference between a major downslope windstorm or a minor wind event.

Instead of writing excessively about synoptic storm dynamics (or trying to, atleast), for once, I am going to sit back and enjoy the first (actually, second, see the above images) true rapid cyclone event since I arrived in Anchorage. Like all significant cyclones, it is a multi-faceted event ranging from 100+ MPH winds across the mountains and Turnagain Arm, storm force winds across the marine forecast zone in the Bering Sea and North Pacific, and heavy flooding rains across the coastal ranges..

NWS Anchorage weather headline for this weekend event:

Image

15 Sep 00z NAM 4 km Hi Res 500 hpa:

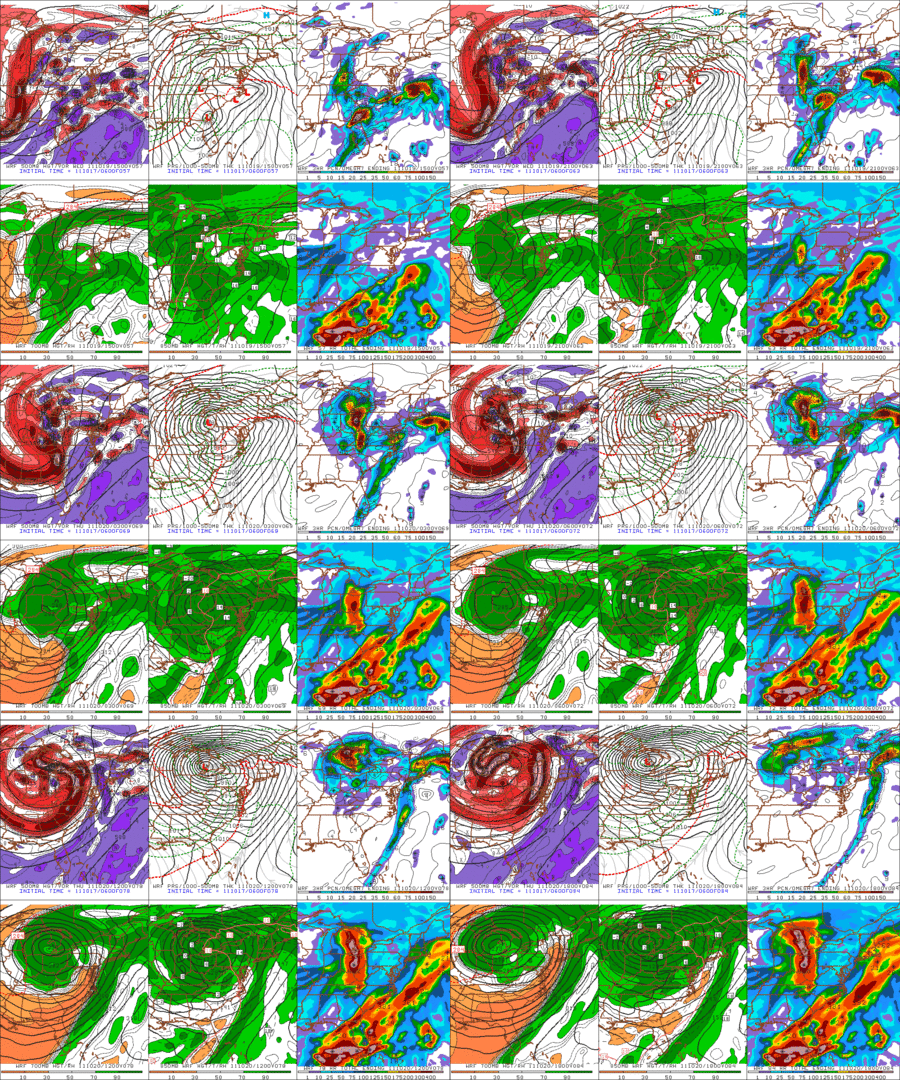
15 Sep 00z ECMWF 39 hr simulation depicting a powerful 972 hpa bent-back occlusion.


The Role of Deep, Moist Convection and Diabatic Heating In Association With A Rapidly Intensifying Cyclone: A QG/PV Analysis

After a long hiatus, I have returned with a new article (finally). I continue my discussion on PV dynamics (I am always learning something new each day), but this time focus more on PV non-conservation. My motivation for this case study/paper came from a challenging winter storm we had to deal with at the North Platte WFO. Numerical models poorly simulated the rapid intensification of a cyclone ejecting the Rockies, and the event ended up being a local high impact storm for the CWA. It was also a null event across portions of North Dakota as the cyclone rapidly intensified and stalled.  The culprit for rapid intensification was the initation of deep, moist convection near the center of the cyclone/warm front and the generation of low level PV through differential diabatic heat release which influenced the low level mass fields and advection patterns. It was a unique case study, and I hope it is of use to other forecasters/weather enthusiasts out there. Please take the time to closely view the images (the small details made all the difference in this event!), especially the “dprog/dt” analyses of PV generation/destruction. The link is the local office case study (still in review by my SOO) in .pdf format (6 MB’s). As always, any questions/comments/criticism/feedback are always welcome.

My next article, I hope, will stray away from rapid cyclogenesis and delve into “negative” feedbacks to cyclone development–a forecast which can be equally as challenging as rapid positive feedback cyclogenesis.

Also, take a look at the references. The Brennan paper on PV non-conservation is superb.

Feb28_29thCaseReview


The Potential Role of Moisture/Latent Heat Release and Cyclone Self Development (Sutcliffe-Petterssen Self Development)

Numerical weather model progs have consistently suggested the potential for an east coast long wave trough for the past 2 weeks. One significant area of model inconsistency has revolved around the potential for deeper cyclogenesis as the long wave trough interacts with the warm and moist Gulf of Mexico/Gulf Stream air masses. For this potential event, we will discuss the possible roles in moist latent heat release and the “self-development process” on the development of a possible significant cyclone October 19-21st across portions of the Great Lakes and northeastern U.S.

Many authors and research scientists have discussed the role of latent heat release and cyclone development. Both simplified QG equations and PV discussions take into account the role of moist latent heat release (a diabatic process) on cyclone development, and much research revolves around the role of low level PV anomalies. Under the right circumstances, the phasing of PV anomalies in the vertical (low and upper level) can result in mutual amplification of the anomalies through the “self development” process. I have discussed the self development process in greater detail in previous blog articles, but the general process can be summed up as such:

  1. The interaction of an upper level wave disturbance/PV anomaly/jet streak with a low level surface wave/PV anomaly which incites surface convergence
  2. Further surface convergence results in increasing low level wind fields and subsequent warm air advection ascent through the WCB (Warm Conveyor Belt)
  3. Warm air advection ascent in the WCB results in increasing surface pressure falls/low level convergence
  4. Warm air advection in the low levels forces upper level height rises and the development of a shortwave ridge axis ahead of the main trough/upper level PV anomaly
  5. The presence of an upper level ridge axis results in a greater magnitude of differential cyclonic vorticity advection and subsequent forced ascent above the level of non-divergence (LND)
  6. Greater differential cyclonic vorticity advection aloft forces even greater SLP pressure falls and increased low level convergence
  7. The process continues and the cyclone begins to rapidly develop (go back to step one and repeat)

This discussion, however, ignores the many other significant processes that may contribute including potential deep, moist convective processes aiding surface pressure falls, mesoscale forcing along fronts/jet streaks, and moist latent heat release/diabatic processes. Here we will briefly discuss the possible influence of moist latent heat release and the feedback to the self development process discussed above.

Forecast Discussion:

The three day forecast involves several important “players” including an early low amplitude wave acting as a “cyclogenetic trigger”, an intense Pacific jet streak which will eventually “carve” out a long wave trough across the central CONUS, and a tropical plume of moisture in the Gulf of Mexico. How these features interact with one another will have significant impacts on the cyclone development by day 3.

The first feature of interest is the low amplitude upper level wave across the intermountain W.

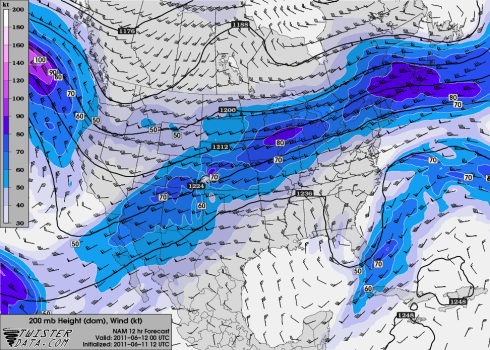
06z NAM 250 hpa heights/vorticity:

Which is clearly seen on the WV channel:

The second feature of interest is a Pacific jet streak just off the west coast of Canada.

The third and possibly the most important feature is a tropical plume of moisture across the southern Gulf of Mexico.

CIMSS satellite derived precipitable water:

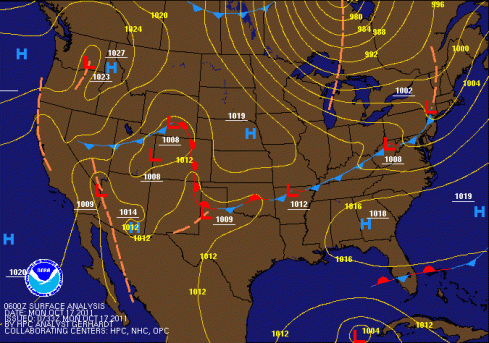
This plume is also associated with an area of organized deep convection (seen on the WV image above) and a weak surface low as analyzed by HPC at 06z:

The intermountain W upper level wave is projected to eject across the central/southern plains with weak surface development as it interacts with an E-W oriented baroclinic zone. Southerly flow is expected to advect the tropical plume of high moisture northward across the GOM and eventually over the Gulf Stream.

Significant numerical model differences begin to arise by day 2.5 as numerical guidance begins to show discrepancies regarding the interaction between the aforementioned synoptic low pressure system and the tropical plume/low pressure across the GOM.

Note by day 2 both the NAM/GFS and ECMWF (not shown) all carve out a significant long wave trough across the central CONUS.

06Z GFS:

06Z NAM:

Subtle synoptic scale differences are evident including placement/timing, but the general pattern is quite similar at day 2.

It has been shown by numerous research studies (and proven by dynamical equations) that moist latent release can have substantial impacts on the evolution of synoptical scale cyclogenesis.

Using a PV approach, where Potential Vorticity is defined as,

where PV is the product of absolute vorticity and the gradient of potential temperature.

Latent heat release through the process of condensation can have significant impacts on both the static stability of the atmosphere (cloud bearing layer) as well as the distribution of theta (and potential vorticity). It has been shown through research and observation that significant diabatic heat release can result in the development of strong low level PV anomalies, which in turn, can have significant effects on low level vorticity and mutual amplification/self development of synoptic cyclones. Moreover, in terms of the topography of the US and its orientation to the Gulf Stream, the low level wind field response to a PV anomaly can result in increased inland moisture advection which can further hasten/supplement the feedback process through increasing condensation across the WCB as well as result in extreme precipitation maxima (potential flooding). It should also be noted that this process can have a negative influence on synoptic scale development, especially when the low level PV anomaly (associated with significant latent heat release through condensation) is displaced away from the parent low.

NAM modeled precipitable water values in the GOM are progged to be in excess of 2.5″ by day 2:

It is pretty clear that significant amounts of moisture will be advecting northward out of the GOM, but how will the eventual cyclone develop?

Note by day 2.5 (hour 60) the NAM has a coupled low level PV anomaly/synoptic surface low near the greatest precipitable water gradient across GA/SC:

Note that the 06z GFS at hour 60 has the synoptic scale surface low displaced from a secondary coastal low (which is associated with the greatest magnitude precipitable water gradient).

Is this difference important? And why do these differences show up? Let us investigate more.

Remember that warm air advection through the WCB results in synoptic ascent, and with high moisture values present, condensation (and possibly deep, moist convection) will be present. The development of latent heat release induced low level PV anomalies can have significant influences on mutual development through changes in both the wind fields as well as thermodynamic characteristics of the air mass.

Note the rather significant differences in convective precipitation in the 06z NAM and GFS at hour 66 (previous 6 hr QPF total):

NAM:

GFS:

Note how the NAM has a separate precipitation maximum near the SC/NC border. Also note that much of the precipitation of the GFS is well off coast. Areas of significant convective precipitation can imply regions of significant latent heat release in the low/mid levels of the atmosphere. These areas are possible regions where low level diabatic induced PV anomalies may develop.

Note the significant difference in the low level vorticity by hour 66:

Also note the farily significant differences in the low level mass fields in response to the low level PV:

Note the NAM has the strongest 850 hpa low level jet near the region of high low level absolute vorticity (implying high PV) when is then tied to the location of the greatest latent heat of condensation. These differences begin to have significant impacts on cyclone development as local wind fields near the low level PV anomaly greatly influence the behaviour of warm air advection (and the sea level pressure falls).

Note how the 850 thermal ridge “curves” inland and into the low level circulation on the NAM.

Whereas on the GFS WAA is mazimized off coast with little inland advection:

So what does this all mean? Going back to the bulleted list above, mutual development/self development is much stronger in the NAM than the GFS, and this can be tied to subtle differences regarding the development of the diabatic induced low level PV, the interaction of the low level PV with the synoptic low, the associated warm air advection regime, and associated precipitation processes (due to both model convective schemes as well as the aforementioned differences).

Once this process is underway, rapid and intense cyclogenesis commences. Using the NAM as an example, classic self development/mutual development occurs as the upper level PV anomaly interacts with the low level diabatic induced PV.

By hour 57 note the relatively “flat” 250 hpa height field in the NAM simulation:

Note by hour 72 the significant shortwave ridge axis which has developed (pink line):

Note the “destruction” of PV (relative vorticity in this case, but it can imply PV) and the development of an anticylonic shortwave ridge axis):

This further implies greater values of differential cyclonic vorticity advection above the level of non-divergence and subsequent pressure falls. This further increases low level surface convergence (and if the low level PV anomaly induced via diabatic latent heat release is co-located with the synoptic low) can result in an additional feedback preocess: increasing inland low level moisture advection. This can further increase low level latent heat release and force even greater surface pressure falls as the process repeats.

NAM precipitable water loop. Note how the diabatic induced PV anomaly and the synoptic surface low are “co-located”, thus enhancing the process of LHR, WAA, and DCVA (differential cyclonic vorticity advection):

This is classic mutual development/self development at work, and it also shows the sensitivity to various model processes such as the model convective scheme, boundary layer schemes (associated with air-sea interaction and the feedback to the low level moisture/theta-e fields), precipitation schemes, etc.

The final solutions, while relatively similar, do vary significantly in the placvement and intensity of the surface low.

06Z GFS @ 84 hours:

06Z NAM @ 84 hours:

06Z NAM animation:

Note the GFS low level theta/SLP (925 theta) in the animation below how the latent heat release/thermal advection induced PV anomalies (seen in SLP maxima) never co-locate with the parent synoptic low (resulting in weaker mutual amplification/self development) and a weaker (albeit still quite strong) overall solution (NAM 976 mb/GFS 990):

Why does all this matter? Having an understanding of the processes involving cyclone development as well as potential model bias will give the forecaster a huge advantage in interpreting the possible final solution. Knowing what features to track (i.e., the position of the tropical moisture plume), understanding model bias such as convective paramaterization schemes, boundary layer schemes, etc., the forecaster will both be able to diagnose potential failure modes within the individual models as well as better forecast the eventual impacts. Of course we are not even considering the usage of dprog/dt analysis, other numerical models beyond the NAM/GFS, MOS guidance, ensemble guidance, etc.

Once again, meteorology is a beautiful thing when it makes sense. The art of meteorology is understanding how to interpret the mass amount of information and develop it into a forecast with clear impacts to the public/user. What do I believe will happen? It does seem the latest NAM guidance is a bit too “amped” up, and that is likely a product of its convective generation due to its over-amped convective scheme and liberal development of DMC near the cyclone low. Using the latest dprog/dt of the global guidance, it is clear the global models are still “catching up” the observations and trending a bit stronger (the NAM was clearly the best at simulating the current tropical development in the GOM), not to mention the global models will typically be less skillfull at simulating the processes involving DMC than various non-hydrostatic models such as the NAM (and less aggressively filtered guidance such as the RGEM), although in this case, it does seem the NAM is a bit too aggressive given the overall synoptic wave setup. Were I to make a forecast now with impacts listed, I would likely make heavy use of more intense guidance such as the NAM and less use of the global guidance (for reasons listed above) and would consider the extreme end for possible future updates to impacts. Were this a winter weather event, the impacts would be even greater as blizzard conditions would be a likely scenario. It should also be noted rather significant run-to-run inconsistency will likely occur as small errors will have rather large impacts on the eventual forecast so relying on any one individual model run would likely be a poor choice (but also waiting for the models to “agree” would result in a poor lead time).

A followup blog post will be made after the fact to discuss the eventual impact and the correct forecast.

Further reading for the inquisitive:

http://journals.ametsoc.org/doi/pdf/10.1175/1520-0493%281992%29120%3C0893%3AAMASOT%3E2.0.CO%3B2

http://journals.ametsoc.org/doi/pdf/10.1175/MWR2959.1

http://journals.ametsoc.org/doi/pdf/10.1175/2007WAF2006044.1


High Plains Convection, the Ineffectiveness of Surface-6 km Bulk Shear, and the Effectiveness of IPV in Synoptic Diagnosis.

Summer time atmospheric flow is characterized by the retreat of the Polar Front deep into the high latitude reaches of the Northern Hemisphere.  The westerly flow often times becomes dominated by shallow PV anomalies passing through the flow.  The lack of snow cover and long, intense insolation result in strong surface heating and the development of terrain induced diurnal flows.  This effect is most commonly seen across the High Plains of New Mexico, Colorado (Front Range), and portions of eastern WY where mountain valley circulations and smaller scale mountain slope flows can result in favored regions of convective initiation/enhancement.

The unique and very complex terrain of the Colorado mountains and High Plains can result in enhanced convective initiation and local wind fields spanning the meso-gamma to meso-alpha which go on to strongly influence eventual storm mode.  Areas of enhanced convective initiation include the Front Range, Sangre de Cristos (and the various sub-ranges including the Culebra Range, Crestone Range, Spanish Peaks, etc.),  and the Palmer Divide to name a few.

On the afternoon of Saturday, June 11, surface observations shows the combined unique effects of moderate cross-barrier westerly flow impinging upon the high terrain of the Rockies (leeside troughing) and the diurnal mountain-valley circulations resulting in the southeast upslope flow:

Often times the “parameter” of first choice regarding severe convective potential and storm mode is the surface-6 km bulk shear parameter.  In short, surface-6 km bulk shear is simply the length of the hodograph (the addition of shear vectors) from the surface to 6 km.  The amount of shear has a strong influence on storm mode and behaviour (in combination with CAPE/instability/synoptic flow pattern).  Sufficiently strong shear (associated with increasing winds with height which is then correlated to synoptic scale disturbances) through the effective updraft can result in rotating mesocyclones and associated supercells.

A quick look at the NAM surface-500 hpa bulk shear (typically the same as surface-6 km) at 21Z shows shear values less than 30 knots across southeast Colorado.

SPC mesoanalysis also shows less than 30 knots of surface to 6 km bulk shear values:

This would be indicative of non-supercell type multicell thunderstorms and/or single cell updrafts.  However, a quick look at the sounding is far more telling:

Note the strength of the wind fields above 400 hpa and the additional shear available to high based parcels.  This environment would be conducive to high based supercells with rotating mesocyclones owing to the vertical pressure gradient forces (VPGF) associated with a sheared and unstable environment.

As we will see later, convective initation was favored across high and thin mountain ranges across southeast Colorado–a common location for summertime DMC across Colorado.  This favored location is due to the terrain induced slope flows associated with differential heating of high terrain (with respect to the lower plains) which results in upslope anabatic flow during the day (katabatic drainage flow during the night).  Given many of the ranges across southern Colorado range from 10,0000-13,000 feet with isolated higher peaks, it is likely updraft bases are higher than 600 hpa (over 15000 feet MSL or 10,000 feet AGL with respect to the height of the High Plains).

Indeed, observations from across the area showed thunderstorms in the area with clear skies (ASOS ceilometers only hits on clouds below 12,000 feet AGL), suggestive of the very high bases.

KLHX 111953Z AUTO 15015G26KT 10SM CLR 31/12 A2988 RMK AO2 PK WND 15026/1949 LTG DSNT SE AND S SLP055 T03060117

It should also be noted that the mountain terrain would likely locally enhance dewpoint/temp profiles (owing to the localized slope flow induced convergence/moistening) which would likely enhance the thermodynamic properties (enhance CAPE) of bouyant parcels initiating across the mountains.

The secondary question quickly becomes what does IPV/PV have to do with this?

Typical summer flow across the intermountain west is dominated by shallow upper tropospheric PV anomalies passing through the mean flow.  Often times there is little to no reflection in the 500 hpa height field evident in the flow as the “depth” of the anomaly is only relegated to the highest portions of the troposphere.  Unfortunately, most meteorologists are trained to make use of the 500 hpa height/vorticity field only, and indeed most atmospheric synoptic plots only include this level.

Note at 18Z, June 11–there is a relatively “flat” height field across Colorado:

The mean trough is well to the west over the West Coast.  This would be indicative of possibly low/weak convective potential as the synoptic flow (using 500 hpa charts) is not conducive to forced ascent and enhanced synoptic convergence and sufficient upper level shear.  However, this is misleading, and a quick look at the 1.5/2.0 PVU surface shows the presence of a number of shallow anomalies aloft.

Note the anomalies are rather shallow in nature and do not extend much beyond 300-375 hpa.

Worth noting is the well defined 500 hpa “kink”/wave in the height field which develops as the anomaly ejects out of the Rockies and translates eastward through the High Plains:

This is likely due to the vertical stretching of the upper level anomaly as it both ejects out of the Rockies and interacts with the low level thermal anomaly across the plains east of the Rockies.  This results in the development of cyclonic vorticity owing to the conservation of potential vorticity along theta surfaces.  This can also be explained via QG theory.  In other words–imagine the path a low level theta surface follows as it ejects out of the Rockies (downslope).

Image Courtesy of CIRA

Image Courtesy of University of Wyoming

As expected, the presence of these shallow anomalies enhances the upper level wind fields:

which has a strong influence on storm mode and development owing to the sheared environment.

So what eventually occurred?

A cluster of supercells initiated off the high mountains of southern Colorado across the zone of enhanced high level vertical shear where the upper wind fields were maximized associated with the ejecting anomalies (see image above).

A close-up view of initiation associated with enhancement via terrain:

Note the high level shear–clearly evident in the long anvils.

It is clear that care must be taken when evaluating the atmospheric environment.  The atmosphere does not work solely at 500 hpa or with simplistic parameters such as surface-6 km bulk shear.  An understanding of local terrain, climatology, storm environment, relevant synoptic features must all be considered or significant forecast “surprises” and/or errors will result.

As always–meteorology is such a beautiful thing when it makes sense.

Weather is always cool.


The Beauty of Our Atmosphere

One thing that inspires me as a meteorologist is the simple beauty of weather and atmospheric motion.  Sometimes lost in all the equations, theory, and weather maps is the natural elegance of atmospheric fluid flow,  unbound by “scales of motion”, “parameterizations”, and the “conceptual models” humans often employ to try and explain the seemingly complex nature of weather. In reality, weather is perfect and without flaw, and sometimes we just need to sit back and admire the artistic and magnificent splendor of the natural world.  Perhaps it is a reminder to us all that the simple things in life are the most important.

Timelapse video by NASA shot in the Canary Islands.

In the words of my favorite Atmospheric Science professor ever, “Weather is cool”.

Enjoy.

El Cielo de Canarias / Canary sky – Tenerife from Daniel López on Vimeo.


Deep Cyclogenesis and the Utility of Potential Vorticity “Thinking”

In terms of the unstable stratification of a fluid, different types of cyclogenesis can manifest itself in the mid-latitude westerlies.  It is the forecasters responsibility to understand what is happening from a full “3-Dimensional” aspect.  Our atmosphere does not work on 2-D surfaces or only at 500 hpa, 700 hpa, 850 hpa, etc.  A continuous spectrum of differing types of cyclogenesis exists with examples including open wave upper disturbances over intense low level baroclinic zones, wave deamplification, deep tropospheric cyclogenesis over moist low level baroclinic zones, etc.  Understanding the type of “potential” cyclogenesis is a key to understanding how the eventual baroclinic system will develop.  Models are not the answer–they are just the guidance tool to provide the meteorologist with the details needed to assess the state of the atmosphere.  Let’s move on.

NOTE:  All images below can be enlarged by clicking them.

A tropospheric deep, “vertically stacked” cyclone is currently rapidly developing over the northern plains.  As per usual, this type of cyclogenesis was not particularly well modeled by the numerical guidance as it is deepened faster and stronger than progged.  The resultant surface low is much farther west and “bent-back” into the low level thermal gradient.

12Z GFS model progs from a couple days ago at 500 hpa with the forecast time of 18Z Saturday:

And the surface pressure/theta-e fields:

Compare to the current 18Z analysis at 500 hpa:

The European 48 HR forecast (left panel is the ensemble mean, right is the operational) performed better, but it was also too weak and was an open wave aloft.

Which shows up much better in the surface fields.  48 hr ECMWF forecast:

12Z analysis today:

Note how the low is “bent-back” and much farther W than progged with a deeper surface low and stronger cold side gradient.  These type of forecast changes have significant effects on the eventual forecast.  If the forecaster simply “responds” to each model forecast as it continually changes, then their forecast will never be right if the models are constantly playing catch-up to observations!  Most importantly–the high impact effects of the storm won’t be relayed to the public in a timely manner.

Watch the progression of the 54 HR GFS forecast to the eventual analysis at 18Z Saturday.  Note how the position of the low changes from southern Canada north of the Great Lakes to central North Dakota .  Also note how much deeper the surface low is as well as the strength of the mass fields owing to the increased pressure gradient (as well as increased vertical momentum transport/mixing).  This is all in a period of 2.5 days of GFS model runs (dProg/dT):

If the forecaster were to simply take each individual GFS forecast verbatim, the forecast would have been a miserable bust with a large number of “jumps” in the forecast.  Both are very undesirable.

In previous blogs I took the time to explain baroclinic cyclogenesis from a standpoint of Quasigeostrophic Theory.  However, in the past 5 months, I have forced myself to learn Isentropic Potential Vorticity, and I have learned its great utility in the forecast process as a result.  I am still learning IPV, but I have seen the high usability of IPV in terms of the type of “cyclogenesis” as it is a more “natural” way to view the 3-Dimensional atmosphere and the resultant flows of baroclinic systems.

Isentropic Potential Vorticity is a pretty broad topic which would take far too long to even try and explain, but what IPV does is essentially explain the “dynamical tropopause” based on potential vorticity identified by the PV gradient on isentropes where PV (image courtesy of RAMMB) is defined as

with units of 10-6 m-2 s-1 K kg-1.

In other words, PV is the mathematical dot product of isentropic absolute vorticity and static stability.  PV is conserved and the quantity can only be changed by changes in static stability and/or friction.  The beauty of IPV is the “invertibility principle” researched and discovered by Hoskins (Hoskins, B.J., M.E. McIntyre, and A.W. Robertson, 1985: On the use and significance of isentropic potential vorticity maps.)  The invertibility principle itself is a rather long and complicated mathematical formulation, but in short, it allows for the calculations of all major meteorological quantities such as winds, heights, temperature, etc. as well as the plotting of PV maps on various surfaces (isentropes, pressure surfaces, etc.)  One variation on the use of  Potential Vorticity is the “Dynamic Tropopause”, or DT.  Typically the Dynamic Tropopause is defined as the 1.5/2 PV surface where PVU’s are “Potential Vorticity Units” (although it can vary between 1-5 PVU’s).  This is typically the “zone” between tropospheric and stratospheric air.  A “positive” PV Anomaly can therefore be defined as a local minimum in the tropopause and an area of cyclonic vorticity.  Morgan and Gammon (see references below) discuss the usage of the dynamic tropopause,

This analysis (here referred to as a tropopause map) exploits the rather simple distribution of tropospheric PV: as will be demonstrated in the next section, isentropic gradients of PV are concentrated at the tropopause. Tropopause maps are a compact way to represent this distribution. Thus, the essential character of the upper-tropospheric PV may be depicted on a single chart, rather than several isentropic maps.”

A deep vertical PV anomaly aloft and a strong potential temperature (theta-e) gradient in the low levels can be favored regions of deep and rapid cyclogenesis owing to a number of factors including moist latent heat release, stratospheric intrusions/tropopause folding, and upper level frontogenesis.  This characterization of the baroclinic atmosphere is referred to as the “Eady model representation”, and it should be noted here that PV usage does not describe the baroclinic atmosphere differently than the various forms of the Quasigeostrophic set of equations, it just uses a different approach (all rely on the N-S equations).

I have found a mixture of the Quasigeostrophic “thinking” combined with “PV thinking” to be optimal in assessing the baroclinic environment and the potential types of cyclogenesis.  For instance, one may want to assess the potential for a deep stratospheric intrusion (a deep vertical PV anomaly)/upper level cold front to interact with a low level baroclinic zone which can incite rapid positive feedback cyclogenesis under the right conditions.  Assessing the Dynamic Tropopause in such situations is crucial in understanding this potential for deep tropospheric cyclogenesis.  It can be shown that a deep DT/upper level cold front will enhance the vertical wind field aloft.  Consider the thermal wind equation:

which essentially states that a deep vertical layer of air consisting of  a strong horizontal thermal gradient through the depth results in increasing geostrophic winds with height.

Think of an upper level cold front cross section:

This is one way to “visualize” the 3-D atmosphere is through the superpositioning of a strong upper level cold front/DT/PV anomaly over a low level baroclinic zone, rapidly resulting in an increase in the vertical depth of the baroclinic zone as the upper anomaly progresses over a low level baroclinic zone.  It becomes obvious that jet streaks are an atmospheric response to propagating PV anomalies in the upper atmosphere.  Therefore the upper level wind fields are strongly influenced by PV anomalies, and the resultant divergent mesoscale jet circulations that develop are simply a response to the anomaly.  This is why rapidly “bombing” surface lows often feature strongly curved and/or coupled jet streaks aloft.

The February 1, 2011 “Groundhogs Day Blizzard” and the coupled jet streak and strongly divergent mesoscale circulation:

400-250 Potential Vorticity:

Also note the WV imagery and the direct “coupling” of the low level deep, moist convection “feeding” directly into the divergent portion of the upper level jet streak.  This is a classic feature in rapidly developing storms, and it can be considered the “warm conveyor belt” typical in synoptic storms.  Once again, it can be shown with PV thinking that low level and deep, moist baroclinic zones with a deep upper level PV anomaly can incite rapid and deep cyclogenesis driven strongly by moist latent heat release and decreased static stability.

It has been studied and shown in numerous studies that the release of latent heat in the low levels can have an enormous contribution to the omega equation vertical forcing (sometimes greatly larger than all the other terms combined):

Often times the influence of diabatic effects (red arrow) is often considered small (and all together dropped) from the omega equation.  However, it has been shown to play a significant role in rapid deepening and can strongly influence potential self-development/mutual development/positive feedback effects on the cyclogenesis process (for more information on self devolopment/rapid cyclogenesis, see : https://pantherfile.uwm.edu/roebber/www/pubs/R93.pdf).  Also note the static stability parameter (in green…the sigma characters) plays a prominent role in all the major forcing terms of the omega equation.  In other words, low static stability plays a major role in rapid development (hence why the most intense lows often have very warm and moist warm sectors.  Also note PV thinking/Eady model development also make use of low level static stability contributions. http://journals.ametsoc.org/doi/pdf/10.1175/1520-0493(1986)114%3C1019%3ATPIOUU%3E2.0.CO%3B2

Note the deep Dynamic Tropopause and the very high values of 925 theta-e for the February 1, 2011 event.  One can imagine how the overlaying of a cold anomaly over a warm and moist baroclinic zone can result in extremely low static stability (and possibly static instability):

It should come as no surprise, looking at the model data, that the Groundhogs Blizzard eventually “bombed” faster than any model projections which had profound effects on the track of the low, the resultant mass fields/wind fields, and the distribution of the precipitation.  It should be noted this event had “several” model solutions ranging from a very weak and “flat” track with the NAM and a moderately NW curving “non-linearly” developing low (GFS/ECMWF) to a strongly curved and intensely bombing low (RGEM).  Understanding model bias and understanding the situation at hand is crucial to understanding the forecast potential.  In this case, the usually “amped” NAM was being influenced significantly by “convective feedback” owing to “overcooked” convection and the mass release of unrealistic latent heat into the upper troposphere.  This warming of the upper levels crippled the model dynamic fields resulting in the unusual “flat” and weak track the NAM developed.

Hard to see here, but the NAM progged a “flat” and weak surface low track–much weaker than all other guidance.  Note the very high values of anticyclonic vorticity ahead of the 500 hpa shortwave–a response to the significant deep, moist convection the NAM was developing ahead of the wave.  Also note in the last frame the eastward “jump” the low takes–a sign of the significant issues the NAM was having in terms of the development of this system.  In reality–the low tracked much farther NW and was much more intense than the NAM projected, and the NAM remained too weak through the entire event.

In reality, as shown above, deep convection can play a strong role in rapid development owing to a strongly divergent mesoscale jet circulation and a direct “coupling” of the low level deep, moist convection feeding into the circulation.

As will be shown in later posts, many different types of cyclogenesis occur spanning a continuous spectrum from deep and bombing non-linear cyclogenesis to steady-state open waves (shallow cyclogenesis) and the resultant low level cyclogenesis.

A good example of shallow cyclogenesis is a classic Alberta Clipper with an open wave aloft and strong cyclogenesis in the low levels–a result of the “shallow” nature of the PV maxes aloft and shallow but intense low level baroclinic zones.  Also note the rather “steady” linear development of the cyclone (compare to a deep tropospheric bombing cyclone).  This is typical in Alberta Clippers owing both to the aforementioned shallow PV anomaly but also due to the significant lack of moist processes (latent heat release in the low levels).

Click the link for an animation of a classic Alberta Clipper developing from Canada to the East Coast:

http://www.meteo.psu.edu/~gadomski/NARR/2007/us0222j3.php

Getting back to the current northern plains storm, why does all this matter?

Note the GFS forecast from the 28th of April, 2011 at 12Z (same as the first plot above with the weak overall solution) featured a deep PV anomaly plotted on pressure surfaces for the 24 hour forecast (note the scale on right–dark blue is a deeper PV anomaly–and we are referencing the anomaly over the intermountain W):

There was significant potential for deep cyclogenesis given the warm sector in place even though the eventual GFS forecast was weak (seen above).  How does this play into the forecast process?  Does the forecaster take the model verbatim and run with it?  If one looked at surface fields alone, it would not be in any way obvious anything special was going to happen.  However, the forecaster had other available guidance (the ECMWF…and the Canadian to a degree) suggesting potential for a more significant event (let us ignore the GFS ensemble suite for now to use this as a case example).  Understanding the type of cyclogenesis is absolutely crucial to being able to identify where the model solutions may potentially “bust”.  Moreover, using such a “dynamic” assessment of the atmosphere, one can apply model bias as well as forecaster “experience” in such a situation to add significant benefit to the forecast.  Models are tools–they are NOT the solution, and using models as solutions only will result in bad forecasts and very significant busted forecasts during high impact events.  Let us continue.

By the 29th of April at 00Z (12 hours later), the 12 hour forecast panel suggests an even farther S and slightly broader DT.

The result, owing to stronger cross barrier flow across the Rockies, was an increase in low level warm air advection across the warm sector due to increased lee side troughing (which can be described through the conservation of potential vorticity as well as through quasigeostrophic theory by setting a lower boundary condition and deriving a new set of equations).

Note the warm air surging off the high plains into KS/OK (and how much stronger it is in the 29th April, 12 Z forecast):

And explained through the Quasigeostrophic Chi equation, increased low level warm air advection (which decreases with height aloft) will drive height rises aloft:

Which I explained much more thoroughly in this post: https://jasonahsenmacher.wordpress.com/2010/11/12/centralnorthern-plains-cyclone-event-1112-142010/

Note the upper level height response manifested in increased ridging aloft over MN and into Canada (500 hpa vorticity):

By this time, it was clear to the forecaster that the potential for tropospheric deep cyclogenesis owing to the deep PV anomaly aloft, the warm anomaly in the low levels (high theta values which corresponds to high PV), and the southern trend of the upper anomaly which resulted in even richer low level warm air advection (thus strengthening the low level baroclinic zone (and the corresponding PV anomaly in the low levels).

Notice how the guidance was rapidly deepening the low/mid levels with time with the 12Z GFS forecast on the 29th (500 hpa vorticity).  Also note, in this situation, the 500 hpa level is not indicative of the region of mass divergence.  In other words, 500 hpa is typically the atmospheric pressure level often evaluated for the placement of upper level waves since the average level of non-divergence (LND) is 550-600 hpa.  In this case, the LND would likely be well above 500 hpa into the upper troposphere.  Care must be taken when evaluating upper waves as 500 hpa alone may not be representative.

Note how the superposition of the upper anomaly over the warm anomaly in the low levels results in deep and rapid cyclogenesis/height falls and the “creation” of cold air in the low levels (watch the 925 theta-e fields with time).

This can be explained through the “interaction” between the positive PV anomalies in the upper and lower levels and the stretching of vorticity through the vertical.

It is also a result of the “descent” of the upper level cold front into the lower levels of the atmosphere–and as shown earlier–can be tied directly to an increase in the upper level wind fields.  From this point, classic “mutual development”/positive feedback cyclogenesis occurs.  Deep height falls and cyclogenesis results in increased wind fields and mass transport of warm air into the warm sector as well as the development of a TROWAL as warm air is advected onto the backside of the upper low and above the descending upper level cold front.  According to the QG Omega equation, WAA will result in synoptic ascent, but this WAA through the warm sector also increases the baroclinity farther northward.  According to the thermal wind equation–an increasing thermal gradient in the horizontal results in stronger wind fields aloft.  As a result, a distinct jet coupling aloft develops which results in increased values of divergence and a stronger warm conveyor belt which drives stronger WAA which then supports greater synoptic ascent and faster low level pressure falls/mass convergence.  Horizontal confluence in the low levels increases frontogenesis values (horizontal deformation contribution)

and mesoscale ascent along the front where yellow is the axis of dilatation.  In certain cases–it has been shown that precipitation processes/moist processes associated with ascent along the front can contribute significantly to vertical forcing and associated low level pressure falls owing to latent heat release.

Note how the jet coupling aloft develops (the secondary jet especially in Canada) in response to the increasing WAA into Canada (increasing low level warm front as well) and subsequent increase in the horizontal thermal gradient:

By this point warm air advection ascent associated with the TROWAL and increasing curved jet level divergence results in a bent back surface low with a strong cold side gradient:

This is classic self development/positive feedback cyclogenesis, and there are multiple mechanisms (besides the one mentioned above) that can create positive feedback cyclogenesis.

The effect of a descending upper level cold front and deep tropospheric cyclogenesis also tends to result in very efficient mixing through contributions of strong vertical descent over the cold sector and the destruction of inversions.  This can have significant results on the overall wind fields in the low levels.

Note the deep mixed layer and extreme mixing potential in the May 1, 00Z KRAP sounding:

Positive feedback cyclogenesis can occur in many ways, but this is one example of where mutual development strongly driven by intense WAA can result in rapid cyclogenesis.

It is typical in these situations for models to be in constant “catch-up” mode and they will potentially be adjusting all the way to the final event.  Note the NAM surface fields from the day 2 forecast until analysis at 18Z April 31 (especially note the much slower/farther W track and the stronger mass fields):

While numerical models are amazing tools, the complex statistical data assimilation systems are not capable of responding to rapidly changing observations once positive feedback begins.  Moreover, models are influenced heavily by the previous analysis field, so under a situation where there is a “cascading” effect, models will always be “behind”–sometimes multiple iterations behind reality.  It is the forecasters responsibility to assess this potential as it can have massive impacts on the eventual forecast–as seen here.

The eventual storm deepened to 987 hpa, well below the 2 day model progs, and even below the current model analyses.  The low was farther west into the cold air than progged by the guidance, and the storm moved much slower.

Wind gusts at Buffalo, SD were in excess of 75 MPH and many locations saw sustained winds of over 50 MPH.  Locations in ND saw significant life threatening blizzard conditions for a prolonged period of time.  Some locations saw over one foot of snow with 60+ MPH winds within the blizzard locations.

It is quite obvious that models are not the solution–they are only a tool in assessing the atmosphere.  Having a strong understanding of the processes at work is an absolute must, and understanding how numerical models simulate the atmosphere is crucial in understanding their weaknesses as well as biases.  Potential Vorticity thinking is just another tool available to the forecaster which can significantly aid in assessing atmospheric processes, and as I continue to learn, I hope to add more posts in the future as well as expand on PV/IPV topics.

As always, meteorology is a beautiful and wonderful thing when it makes sense.  Dynamic assessment allows the forecaster to “view” atmospheric flow in a more natural way.  Having this understanding no longer makes us a slave to the numerical models, but it gives us the ability to not only see “potential” but to avoid big high impact forecast busts as well.   Most importantly, it allows the forecaster to view the forecast from a different perspective.  One can fill in the “details” in their head–and it gives them the ability to analyze the things that matter and disregard the things that really don’t mean much in the end (for instance–model derived isentropic ascent/descent and model vertical velocity fields)–an important quality in these days of “too much information” and busy forecast schedules.  Knowing what to “track” and analyze and what influences baroclinic development will give the forecaster the ability to “see” potential for significant deviations in the model forecast or for things to be stronger/weaker than progged.

References:

http://onlinelibrary.wiley.com/doi/10.1034/j.1600-0870.1995.00124.x/pdf

http://journals.ametsoc.org/doi/abs/10.1175/1520-0493(1998)126%3C2555%3AUTMTDM%3E2.0.CO%3B2

http://journals.ametsoc.org/doi/abs/10.1175/2008JAS2921.1

http://journals.ametsoc.org/doi/pdf/10.1175/1520-0434(1988)003%3C0217%3ATROLHR%3E2.0.CO%3B2


Turbulent Hydrodynamic Flow

In particular weather patterns, I often see the casual weather observer, the weather enthusiast, and even trained meteorologists/forecasters claim, “The models stink!”.  Do the models really stink?  Not really–it is just a natural part of weather variability.  The chaotic nature of the atmosphere has a tendency to display itself in a much more prominent fashion in particular patterns.  In those times, it is the forecasters responsibility to understand the pattern at hand and take those into consideration.

Consider this forecast for the CONUS for the next week.  The NAM 12Z run shows the mess of cyclones/vorticies/shortwaves in the mean flow over the CONUS at 84 hours:

It is a big mess–and one must consider the wider picture before moving on here.

The medium range pattern will be dominated by an active Pacific jet and a +PNA pattern

No anomalous blocking regime exists downstream in the Atlantic–so the westerlies will likely have free reign to flow across the CONUS.  Typically these +PNA patterns are dominated by an active Pacific Jet with a mean upper level ridge over the eastern Pacific-Intermountain West and troughing over the southeastern CONUS.

The main “player” in all this activity is a very active and intense Pacific Jet stream with several short-wavelength and low amplitude upper tropospheric wave disturbances embedded in the fast westerly flow.  Hydrodynamic stability breaks down and perturbations grow and amplify in a non-linear fashion.

The 12Z GFS depicts this perfectly on the dynamic tropopause (top image).  The dynamic tropopause here is depicted using the tropopause pressure–and the jet pattern can be seen in the lower tropopause pressures.

With such a fast and active jet–the Reynolds number becomes rather large and will eventually break down into turbulent flow.

Not only that–but the moist and intense low level marine baroclinic zone is conducive to positive feedback and highly non-linear growth and amplification/baroclinic development.  What eventually develops is a train of chaotic energetic baroclinic waves.  Such a pattern is going to be MUCH more challenging for models to handle than a flow dominated by meandering rossby waves and/or laminar flow.

Do the models stink?  No–quite the opposite in fact.  Does chaos/turbulence rule?  Yes.  Edward Lorenz explained this well in “Nonperiodic Determinstic Flow”.  The Navier-Stokes equations and the dynamical laws can not perfectly account for turbulence in the flow.  It is chaotic–and only a statistical representation is possible.  In other words–we will never be able to perfectly model chaotic/turbulent flow–at least not in our lifetimes.  What eventually happens is tiny errors in the model analysis (timing/amplitude/strength etc.) feeds back rapidly as the waves grow unstably–which eventually results in a very low probability forecast. What can one do under such a forecast scenario?  Ensemble forecasting and a good understanding of the potential wave pattern can make for a much less “jumpy” forecast.  How does one forecast such a pattern?  That will be saved for another post to come.


The Froude Number and Stable Flow: Mountain Blocking

A powerful low amplitude shortwave ejected into Montana this morning in association with a 160 kt Pacific Jet.

The 0Z NAM from yesterday clearly depicts this feature:

Large scale and mesoscale ascent developed rapidly as the jet core amplifed over the region.  Note the large increase of high level moisture associated with a region of strong vertical ascent:

0545Z:

Three hours later at 0845Z:

Low amplitude intense shortwaves such as these have a tendency to develop significant upward vertical velocity/downward vertical velocity couplets which support rapid cyclogenesis and regions of strong pressure gradients over small areas (i.e. rapid intensification, or the second partial of p with respect to x, gradient of the gradient).

Note the rapid pressure rises, on the order of 8+ mb’s / 3 hours over northern MT as extreme cold air advection set in behind the front.

The surface analysis depicts the strong surface ridging associated with the extreme subsidence mainly owing to strong cold air advection behind the cold front.  Also note how surface ridging amplifies as the high pressure region interacts with the Rockies.  The Rockies “block” the subsident air from progressing westward, therefore air builds at a faster rate east of the Continental Divide resulting in stronger surface ridges:

The Great Falls sounding at 0Z shows the flow was mainly out of the N in the low levels and NW in the mid levels.

Great Falls is around 3700 feet, so in this sounding, stable N flow extended to nearly 10,000 feet, or over 6000 feet AGL.

The Belt Range south of Great Falls extends to around 6000-8000 feet and reaching top elevations greater than 9000 feet.  Also note they form a “bowl” type shape around the region.  This makes it very difficult for air to flow around the mountains.

The Froude number,

relates the inertial forces to the gravitational force.  Think of it as a relation of kinetic energy to potential energy where V is velocity, N is the brunt vaisala frequency, and L is the height of the mountain.  Therefore, think of it as relating KE= 1/2mv^2 to PE = mgh.  The brunt vaisala frequency is: 

Note the gravity term (remember mgh) and the static stability d-theta/d-z (the more stable the air mass is, the greater the kinetic energy will need to be for air to ascend the range).

A series of radar images shows how stable N-NW flow “bunches up” into the valley as stable flow is blocked by the mountains south of the valley.  Low level stable air builds into the valley and it acts to “uplift” air above it, much like Cold Air Damming:

Note in the surface obs the heaviest snow develops coincident with rapidly rising pressure as stable air builds into the valley while V simultaneously weakens (weak V, which means lower kinetic energy, therefore the flow can not ascend the mountain).  Note also that downslope flow into the valley was not able to kill of the qpf.  Also note the powerful cold front (green) with G into the 60s.

High res models were trying to show a large weather hole over Great Falls associated with downsloping into the valley.  A good example showing high res models can struggle mightily in compex terrain:


The Importance of Model Timing: Ohio Valley and SE Rain Event

Click on images to see an enlarged view.

The timing of upper level features in numerical models is crucial to the eventual weather patterns they subsequently simulate.  There are times, however, when the difference in timing can have significant feedback effects with errors which grow rapidly with time.  The forecast for the Ohio Valley and SE U.S. shows significant model divergence within the first 48 hours amongst the current 0Z NCEP model guidance.  The GFS is illustrating a large rain event while the NAM is much weaker with eventual cyclogenesis and keeps precipitation much farther south.  Let’s take a look why they are so different and why the current 0Z NAM is likely going to be wrong.

All numerical guidance is more or less the same by 24 hours with the large scale synoptic features.

Both feature a large scale upper trough over the central CONUS with a low amplitude shortwave embedded near the base of the trough.

Fast forward to 33 hours and things still look mostly the same.  However, upon closer inspection, it is clear the NAM has the leading shortwave at the base of the trough displaced further W than the GFS–in other words, it is slower.

The GFS, shortwave circled:

NAM:

Also note the slightly higher amounts of shear vorticity upstream of the shortwave in the NAM compared to the GFS.  Essentially the mid-level speed max is displaced farther W in the NAM.  Also note a very low amplitude and subtle downstream ridge is developing in the GFS ahead of the shortwave.  Why?

Note in the GFS 850 hpa theta-e field a large region of warm air advection has developed ahead of the upper level shortwave (circled) with a stronger low level circulation.

NAM:

Note the NAM features a much weaker wave as opposed to a developed low level circulation.  While the theta-e profile is similar to the GFS, the NAM features no warm air advection as the 850 hpa winds are mainly parallel to the theta-e gradient.  I can’t hammer the point home more, but low level warm air advection decreasing with height lends itself to upper level height rises.

Stronger cyclogenesis is a positive feedback process.  As was shown in the previous post as well, an upper level baroclinic wave interacting within a region of low level baroclinity results in developing cyclogenesis.  Vorticity advection by the geostrophic wind in a shortwave trough results in height falls aloft and forced synoptic ascent.  This forced ascent, if above the level of non-divergence, and because the atmosphere follows the laws of mass continuity, will result in a low level mass response and increasing low level convergence/cyclogenesis.  Low level diabatic heating (see the previous post for a more in-depth reasoning) mainly owing to the release of latent heat as low level moist air rises and condenses will only hasten the process–and this system has ample amounts of Gulf moisture to process.  Meanwhile, the thermal gradient in the low levels tightens and frontal boundaries become more defined owing to processes such as horizontal deformation (of the many which can result in frontogenesis).  This is all due to the increasing low level convergence/mass response to upper level forced synoptic ascent.  Mesoscale ascent/convergence along the fronts increases owing to the increasing frontal thermal gradient which results in even more low level mass convergence and increasing surface pressure falls.  Meanwhile, owing to continued synoptic ascent in the upper levels (differential cyclonic vorticity advection) and subsequent cooling, upper level heights begin to fall at a faster rate.  Because the thermal gradient in the lowel levels is tightening, the thermal wind relation

states upper level winds must increase with height.  So not only does the jet stream increase, but upper level heights continue falling at an increased rate, therefore, the amplitude is increasing.  Jet stream divergence increases due to increased cyclonic curvature in the upper level height field and a stronger jet max (as well as a shorter wavelength if the system takes on a negative tilt), therefore, stronger mesoscale ageostrophic jet circulations develop.  Cyclogenesis is now increasing rapidly; this positive feedback loop continues until the low level baroclinic zone has been sufficiently processed.

With that in mind, it is much easier to understand why timing is crucial.  In most cases, the speed of an upper level shortwave just means the timing of cyclogenesis may develop at a different time, but it will develop in a similar fashion regardless of the timing.  In this case, however, a delayed upper level response to a shortwave trough (the NAM) with the large scale trough propagating eastward will result in less warm and moist Gulf air to interact with.  That is, because the NAM is slower with the shortwave, cyclogenesis will be delayed and the positive feedback loop will not be present ( or will play a much smaller role).

Skipping ahead 6 hours, note how much things have changed.

By 39 hours, the upper level shortwave has now “ejected” into the Ohio Valley with an increasingly amplifying downstream ridge ahead of the shortwave.

The NAM, however, features a flat height field ahead of the shortwave with the shortwave much farther W.

As one would expect, the low level mass fields are completely different with the GFS developing a much more intense and deep surface low by 45 hours as deep cyclogenesis has developed strong cyclonic rotation through the depth of the troposphere.  In the mid levels, the GFS features a strong closed circulation while the NAM has a broad open wave.

NAM:

The surface fields are even more dramatic as the GFS has a strong sub 996 mb surface low while the NAM has broad and weak ~1008 mb low.

These differences result in a vastly different precipitation field:

GFS:

The differences are vast.  The GFS solution yields moderate to heavy precipitation over much of Indiana and Ohio associated with a large TROWAL (associated with the strong and deep cyclonic rotation) while the NAM is almost completely dry only 48 hours out!  You can’t really make a compromise because the solutions are so vastly different and would yield a cruddy forecast.  In my forecasting experience, when the NAM features a slower propagating low amplitude shortwave trough than the GFS, it is wrong ~ 90-95% of the time.  Under certain circumstances (as was shown with last storm…read the previous post), the NAM can be right with a slower solution under rapid cyclogenesis events.  However, those cases usually feature much more amplified and intense shortwaves and/or intense PV anomalies.  In this case, I would give the NAM a less than 10% chance of being right.  Because of that, I would simply not even include it in the forecast.  Under these circumstances, it is not unheard of for the NAM to not simulate a realistic solution until the system has already developed.  In other words, it is wrong all the way leading up to eventual cyclogenesis.  I suspect the 12Z NAM will correct a lot, but I doubt it will completely fix it.  As for the GFS, I do believe it is a bit too intense and far west with its surface low track and precipitation field, but it is most definitely the better solution.  The GEM seems like a more reasonable solution with most of the heavy precipitation staying across southern IN/OH with lighter amounts farther north.

In my experiences, the regional GEM is a far more reliable model than the NAM under most circumstances.

This post goes to show how important timing of upper level features can be on the forecast, even in the short-term (in this case only 48 hours).  It also shows how rapidly feedback effects hasten the process of cyclogenesis (IPV thinking explains this very nicely).  Most importantly, this example illustrates why forecasters must analyze both the synoptic and mesoscale features present as opposed to simply reading the model output without interpreting it.  Simply looking at model output QPF or surface fields (i.e. surface pressure fields) without considering the meteorological processes developing those fields will result in less accurate (worse) forecasts.  Learning model biases takes time and requires attention to detail.

The butterfly effect?  Chaos Theory?  Dr. Lorenz proved himself to be many years beyond that of his peers–a genius amongst geniuses.

http://eapsweb.mit.edu/research/Lorenz/Deterministic_63.pdf


Central/Northern Plains Cyclone Event (11/12-14/2010)

All Images Can Be Clicked to Enlarge

An interesting weather event is shaping up for late this week and into the weekend.  A strong PV Anomaly over the intermountain west is going to “eject” into the plains initially propagating along a quasi-stationary frontal zone over the plains before developing into a cyclone as it tracks NE.  The global numerical guidance has been very consistent modeling the general pattern that can be expected, but as always significant run-by-run (and model by model) inconsistencies and large model spreads exist.  Even as we reach the “short-term” (2-4 day forecast period), a lot of variability is still persistent amongst the models.  However, since this is partially a blog about weather forecasting, I thought it would be appropriate to actually make a weather forecast.  In reality, this is the challenge all forecasters need to make on consistent basis, but decisions still need to be made so the appropriate weather risks can be assessed and disseminated to the public (and private) in a timely manner and with sufficient lead time.

As of late this afternoon, a stationary front is parked over the southern plains with a positive tilt trough slowly propagating eastward.  The warm sector across the southern plains is moist with surface dewpoints ranging from the upper 50s to upper 60s.  Moisture is going to play a key role in the eventual cyclogenesis of the storm.

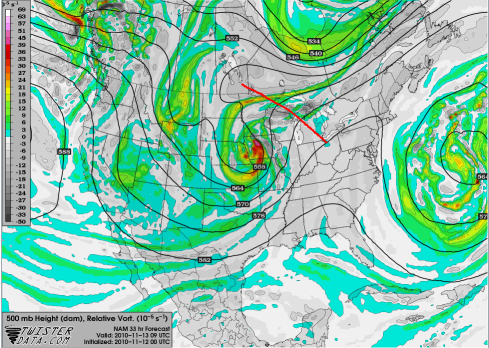
The 0Z upper air map depicts the positive tilt trough:

The 0Z 500 hpa analysis depicts a strong vorticity maxima at the base of the trough:

The NAM 0Z analysis also depicts this clearly in its shaded vorticity fields:

A strong PV anomaly is positioned over the 4-corners with tropopause heights as low as 500 hpa.

The interaction of this strong vorticity maxima/PV anomaly with the warm and moist air mass in the warm sector is likely going to result in a strong cyclogenesis event.

This graphic shows the surface low track of each numerical model analyzed at 12Z yesterday morning (11/11/2010).  It is easy to see the model guidance has significant spreads in both surface low intensity and surface low track.  Note the NAM track in green and the GFS in red.

The 18Z NCEP guidance converged a bit, but the spread is still significant amongst the NAM/GFS.

The Short Range Ensemble Guidance is not much better:

The first 24-36 hours of the forecast is generally pretty clear as all guidance has the upper PV anomaly ejecting into the southern plains and lifting NE along the front.

At 12 hours, (12Z) note the still positive tilt to the trough.  The PV anomaly remains at the base of the upper trough.

Of course, positive tilt troughs are not very conducive to surface cyclone development.  Under this configuration, most of the the time the main belt of westerlies would cut off as the cold air remains well to the north.  Almost all vorticity associated with this trough is due to shear vorticity on the downstream side of the trough.  Cyclonic vorticity advection is minimal ahead of the trough (therefore height falls are not induced…see last post for the QG Chi equation) with any relative vorticity advection offset by planetary vorticity advection on the backside of the trough.

Note that the main jet level winds are on the downstream portion of the positive tilt trough.  Once again, from the thermal wind relation, strong jet level winds reside over regions of enhanced thermal gradients:

What would eventually happen is the trough would slowly “de-amplify” with time as the jet stream propagated northward with weak surface development.  The leftover baroclinic zone over the plains would moderate with time leaving (resulting in a weakening horizontal thermal gradient) an area of enhanced shear vorticity aloft over the region.

With this system though, a couple things are different.  First, as the main belt of westerlies cuts off, cold air advection behind the stationary front ceases to exist.  Weak warm air advection along the stationary front continues as air (on the warm side of the front) weakly advects NE due to the pressure gradient developed by the departing cyclone well into Canada.

Note that, at 850 hpa, cold air advection slackens on the cold side of the stationary front and warm air advection begins to dominate along the warm side as air continues to advect NE in association with the departing cyclone (blue line).  Our stationary front has now developed into a warm front (see inside the red circle).

The front begins to propagate northward as a result of this flow configuration.  Subtle height rises develop aloft due to the weak low level warm air advection decreasing with height (QG Chi equation).

BY 21Z, note that a weak downstream ridge axis has developed in association with the differential warm air advection.  Also note the existence of the upstream shortwave.  Kicker trough?

Why do cutoff lows “kick-out” with an approaching upstream “kicker” shortwave?  There are  a number of differing reasons, but I find the QG approach simplistic and succinct.  (To help differentiate…kicker is the shortwave that “kicks-out” the cutoff low, the cutoff low that “kicks-out” is the kickee).  Note with the incoming  kicker shortwave heights have fallen upstream of the main trough.  This acts to “flatten” the upper level height field in between the kicker and kickee (in between the two systems).  Going back to the QG Chi equation we love so much:

the amount of planetary vorticity advection by the geostrophic wind decreases (remember that f decreases equatorword) on the backside of the main trough (the kickee).  Note in the 12Z upper level height map the trough is advecting increasingly large values of f.  By 21Z (the previous image), with the approach of the shortwave trough upstream, the ridge (over the intermountain west) has flattened and now little to no f is being advected on the backside of the cutoff low.  Heights do not fall on the upstream side, and the small amount of cyclonic vorticity advection on the front portion of the kickee results in slow height falls downstream which results in forward propagation.  The cutoff has now been “kicked-out”.

By 0Z, the downstream ridge has continued to amplify and a lead shortwave at the base of the trough has now developed as large values of cyclonic vorticity are being advected with increasing height falls:

Now the feedback process begins as warm air advection continues in the warm sector.  In a moist system such as this, diabatic affects can be significant as warm and moist air condenses and releases latent heat, especially along the warm front.  This process can act to increase the along-front thermal gradient therefore acting in a frontogenetic manner.  Moreover, the release of low level latent heat due to condensation can act to decrease the static stability of the atmosphere.

In the omega equation, note the location of the static stability parameter in the various RHS forcing terms:

Low static stability acts to enhance the cyclogenesis process during the initial stages of development.

Without considering every forecast hour, skipping ahead to hour 33, the NAM now features a significantly amplified upper ridge downstream and the lead shortwave has now taken on a negative tilt.

Both the NAM/GFS are illustrating an upper level jet coupling combined with the significant low level warm air advection/diabatic heating and subsequent upper level height rises ahead of the main shortwave.  It is likely mesoscale jet circulations will play a prominent role in enhancing divergence (and vertical ascent) and the subsequent cyclogenesis process as well as strong convection along the cold front.  Rapid cyclogenesis and occlusion is likely with this system.


What does this all mean?  First the significant model differences.  The 0Z guidance is in and the spread remains signficant.

The NAM is a significant outlier with its significantly farther W track while the GFS is on the opposite end of the spectrum.   Interestingly, it seems with increasing resolution of the numerical model being considered, the farther W its surface low track is.  After the NAM, the ECMWF (blue) is next followed by all the other global models (CMC, NOGAPS, UKMET, GFS).

Even the 21Z SREF spread is rather large:

Once again though, it seems the W tracks are dominated by higher resolution guidance while the farther E tracks are dominated by the RSM (pink/red), a variant of the GFS used for the SREF data.

It should also be mentioned the GFS and the rest of the global guidance has continued to shift westward with time to match the higher resolution mesoscale models.  First, consider the size of this storm.  In terms of the Rossby Number R, it is rather small compared to a typical synoptic scale system which yields larger values of R:

QG theory works nicely with large synoptic systems, but as R increases, sub-synoptic scale forcing becomes more prominent in the development of the system.  Numerous studies have shown this…and various omega equations have been developed to account for sub-synoptic scale forcing.  Mesoscale circulations are more prominent, and often times the higher resolution models can more effectively forecast these systems.

Lets just illustrate this with a simplistic comparison by arbitrarily choosing the 700 hpa pressure level.

First the 0Z NAM @ 33 hours:

and the GFS at the same time:

A couple things worth noting.  First, the NAM 700 hpa heights are much lower than the GFS.  The low level mass response is stronger in the NAM than GFS, and the low is displaced slightly farther W.  It is common for rapidly developing cyclones to develop farther W than expected.  Why?  It mostly relates to the position of the warm front and zone of warm air advection.  Think of the propagation of a surface low.  The region of surface low pressure will propagate towards the region of strongest surface pressure falls.  It makes sense then that developing surface lows propagate along the surface warm front.  From our earlier discussion, remember rapid cyclogenesis results in more amplified upstream ridging owing to thermal advection/diabatic heating in the warm sector.  Also remember differential cyclonic vorticity advection (along with mesoscale jet circulations), which is a dominant forcing method aloft, results in vertical motion fields which are displaced farther W from the surface low.  Therefore, as surface occlusion begins, low level warm air advection decreases (and subsequent differential warm air advection decreases) resulting in less height rises upstream of the shortwave.  Differential vorticity advection and forced ascent become stacked with the surface low and intensification slows significantly (surface low can still deepen due to forced ascent above the surface but still below the level of non-divergence…in other words, baroclinic processes may still result in forced ascent in the low levels above the surface occlusion…hence why surface lows still deepen after occlusion).  This also results in a much slower track.

FInishing this post up, rapid intensification almost always results in a system displaced farther W.  Global guidance continues to shift W towards the higher resolution model solutions, and the high resolution models are all developing a rather significant TROWAL (Trough Of Warm Air Aloft).  This makes sense as the low level mass fields are much stronger in the high resolution models due to the increased deepening and more rapid intensification.  A strong closed low level circulation results in warm air “wrapping” around the main upper low and a region of enhanced warm air advection ascent on the north then backside of the upper low (this also enhances the development of the surface low farther W and sometimes NW).  Large TROWALS are obviously efficient snow machines in winter since the precipitation falls on the cold side of the storm (in the low levels).

Subsequently, the NAM has a much larger QPF field farther west into the cold side of the storm and a farther W track of the surface low.

With the GFS farther E and with a less defined TROWAL of QPF:

Given the information I have given and the current trends (which further support the dynamic assessment above), and without doing an in-depth analysis of the thermal fields (for brevity), it seems an early season snow event across portions of eastern MN/western WI is likely.  Track wise, I think it will be slightly farther E of the NAM but a tad farther W of the ECMWF which would take it slightly inside the SE Minn border or right along it.  I am also leaning towards the NAM intensity which would yield a mid-level TROWAL well displaced over the low level cold air.  Given this information, it is quite probable a band of accumulating snow can be expected across central and eastern MN into W Wisconsin into the Arrowhead of MN.  It most certainly will be fun to watch.

Finally, as a quick mention, it is worth noting IPV thinking yields similar conclusions.  IPV thinking also deals with the diabatic effects even though potential vorticity is being conserved along isentropic surfaces.  For instance, significant diabatic effects on the warm sector (definitely not adiabatic!) results in the destruction of the upper level vorticity (in the QG perspective…upper level height rises) with increased development of the cyclone in the low levels below the region of latent heat release (strong low level mass response) .