Click on images to see an enlarged view.
The timing of upper level features in numerical models is crucial to the eventual weather patterns they subsequently simulate. There are times, however, when the difference in timing can have significant feedback effects with errors which grow rapidly with time. The forecast for the Ohio Valley and SE U.S. shows significant model divergence within the first 48 hours amongst the current 0Z NCEP model guidance. The GFS is illustrating a large rain event while the NAM is much weaker with eventual cyclogenesis and keeps precipitation much farther south. Let’s take a look why they are so different and why the current 0Z NAM is likely going to be wrong.
All numerical guidance is more or less the same by 24 hours with the large scale synoptic features.
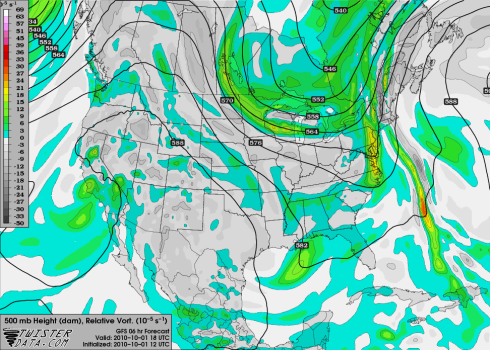
Both feature a large scale upper trough over the central CONUS with a low amplitude shortwave embedded near the base of the trough.
Fast forward to 33 hours and things still look mostly the same. However, upon closer inspection, it is clear the NAM has the leading shortwave at the base of the trough displaced further W than the GFS–in other words, it is slower.
The GFS, shortwave circled:
NAM:
Also note the slightly higher amounts of shear vorticity upstream of the shortwave in the NAM compared to the GFS. Essentially the mid-level speed max is displaced farther W in the NAM. Also note a very low amplitude and subtle downstream ridge is developing in the GFS ahead of the shortwave. Why?
Note in the GFS 850 hpa theta-e field a large region of warm air advection has developed ahead of the upper level shortwave (circled) with a stronger low level circulation.
NAM:
Note the NAM features a much weaker wave as opposed to a developed low level circulation. While the theta-e profile is similar to the GFS, the NAM features no warm air advection as the 850 hpa winds are mainly parallel to the theta-e gradient. I can’t hammer the point home more, but low level warm air advection decreasing with height lends itself to upper level height rises.
Stronger cyclogenesis is a positive feedback process. As was shown in the previous post as well, an upper level baroclinic wave interacting within a region of low level baroclinity results in developing cyclogenesis. Vorticity advection by the geostrophic wind in a shortwave trough results in height falls aloft and forced synoptic ascent. This forced ascent, if above the level of non-divergence, and because the atmosphere follows the laws of mass continuity, will result in a low level mass response and increasing low level convergence/cyclogenesis. Low level diabatic heating (see the previous post for a more in-depth reasoning) mainly owing to the release of latent heat as low level moist air rises and condenses will only hasten the process–and this system has ample amounts of Gulf moisture to process. Meanwhile, the thermal gradient in the low levels tightens and frontal boundaries become more defined owing to processes such as horizontal deformation (of the many which can result in frontogenesis). This is all due to the increasing low level convergence/mass response to upper level forced synoptic ascent. Mesoscale ascent/convergence along the fronts increases owing to the increasing frontal thermal gradient which results in even more low level mass convergence and increasing surface pressure falls. Meanwhile, owing to continued synoptic ascent in the upper levels (differential cyclonic vorticity advection) and subsequent cooling, upper level heights begin to fall at a faster rate. Because the thermal gradient in the lowel levels is tightening, the thermal wind relation
states upper level winds must increase with height. So not only does the jet stream increase, but upper level heights continue falling at an increased rate, therefore, the amplitude is increasing. Jet stream divergence increases due to increased cyclonic curvature in the upper level height field and a stronger jet max (as well as a shorter wavelength if the system takes on a negative tilt), therefore, stronger mesoscale ageostrophic jet circulations develop. Cyclogenesis is now increasing rapidly; this positive feedback loop continues until the low level baroclinic zone has been sufficiently processed.
With that in mind, it is much easier to understand why timing is crucial. In most cases, the speed of an upper level shortwave just means the timing of cyclogenesis may develop at a different time, but it will develop in a similar fashion regardless of the timing. In this case, however, a delayed upper level response to a shortwave trough (the NAM) with the large scale trough propagating eastward will result in less warm and moist Gulf air to interact with. That is, because the NAM is slower with the shortwave, cyclogenesis will be delayed and the positive feedback loop will not be present ( or will play a much smaller role).
Skipping ahead 6 hours, note how much things have changed.
By 39 hours, the upper level shortwave has now “ejected” into the Ohio Valley with an increasingly amplifying downstream ridge ahead of the shortwave.
The NAM, however, features a flat height field ahead of the shortwave with the shortwave much farther W.
As one would expect, the low level mass fields are completely different with the GFS developing a much more intense and deep surface low by 45 hours as deep cyclogenesis has developed strong cyclonic rotation through the depth of the troposphere. In the mid levels, the GFS features a strong closed circulation while the NAM has a broad open wave.
NAM:
The surface fields are even more dramatic as the GFS has a strong sub 996 mb surface low while the NAM has broad and weak ~1008 mb low.
These differences result in a vastly different precipitation field:
GFS:
The differences are vast. The GFS solution yields moderate to heavy precipitation over much of Indiana and Ohio associated with a large TROWAL (associated with the strong and deep cyclonic rotation) while the NAM is almost completely dry only 48 hours out! You can’t really make a compromise because the solutions are so vastly different and would yield a cruddy forecast. In my forecasting experience, when the NAM features a slower propagating low amplitude shortwave trough than the GFS, it is wrong ~ 90-95% of the time. Under certain circumstances (as was shown with last storm…read the previous post), the NAM can be right with a slower solution under rapid cyclogenesis events. However, those cases usually feature much more amplified and intense shortwaves and/or intense PV anomalies. In this case, I would give the NAM a less than 10% chance of being right. Because of that, I would simply not even include it in the forecast. Under these circumstances, it is not unheard of for the NAM to not simulate a realistic solution until the system has already developed. In other words, it is wrong all the way leading up to eventual cyclogenesis. I suspect the 12Z NAM will correct a lot, but I doubt it will completely fix it. As for the GFS, I do believe it is a bit too intense and far west with its surface low track and precipitation field, but it is most definitely the better solution. The GEM seems like a more reasonable solution with most of the heavy precipitation staying across southern IN/OH with lighter amounts farther north.
In my experiences, the regional GEM is a far more reliable model than the NAM under most circumstances.
This post goes to show how important timing of upper level features can be on the forecast, even in the short-term (in this case only 48 hours). It also shows how rapidly feedback effects hasten the process of cyclogenesis (IPV thinking explains this very nicely). Most importantly, this example illustrates why forecasters must analyze both the synoptic and mesoscale features present as opposed to simply reading the model output without interpreting it. Simply looking at model output QPF or surface fields (i.e. surface pressure fields) without considering the meteorological processes developing those fields will result in less accurate (worse) forecasts. Learning model biases takes time and requires attention to detail.
The butterfly effect? Chaos Theory? Dr. Lorenz proved himself to be many years beyond that of his peers–a genius amongst geniuses.


